Introduction
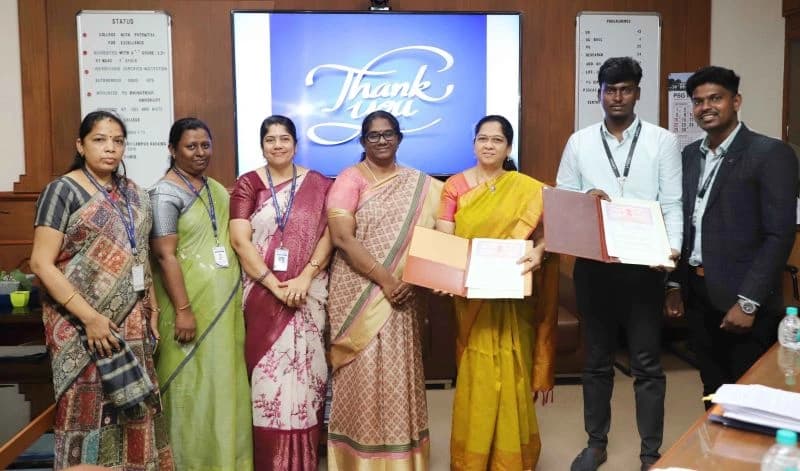
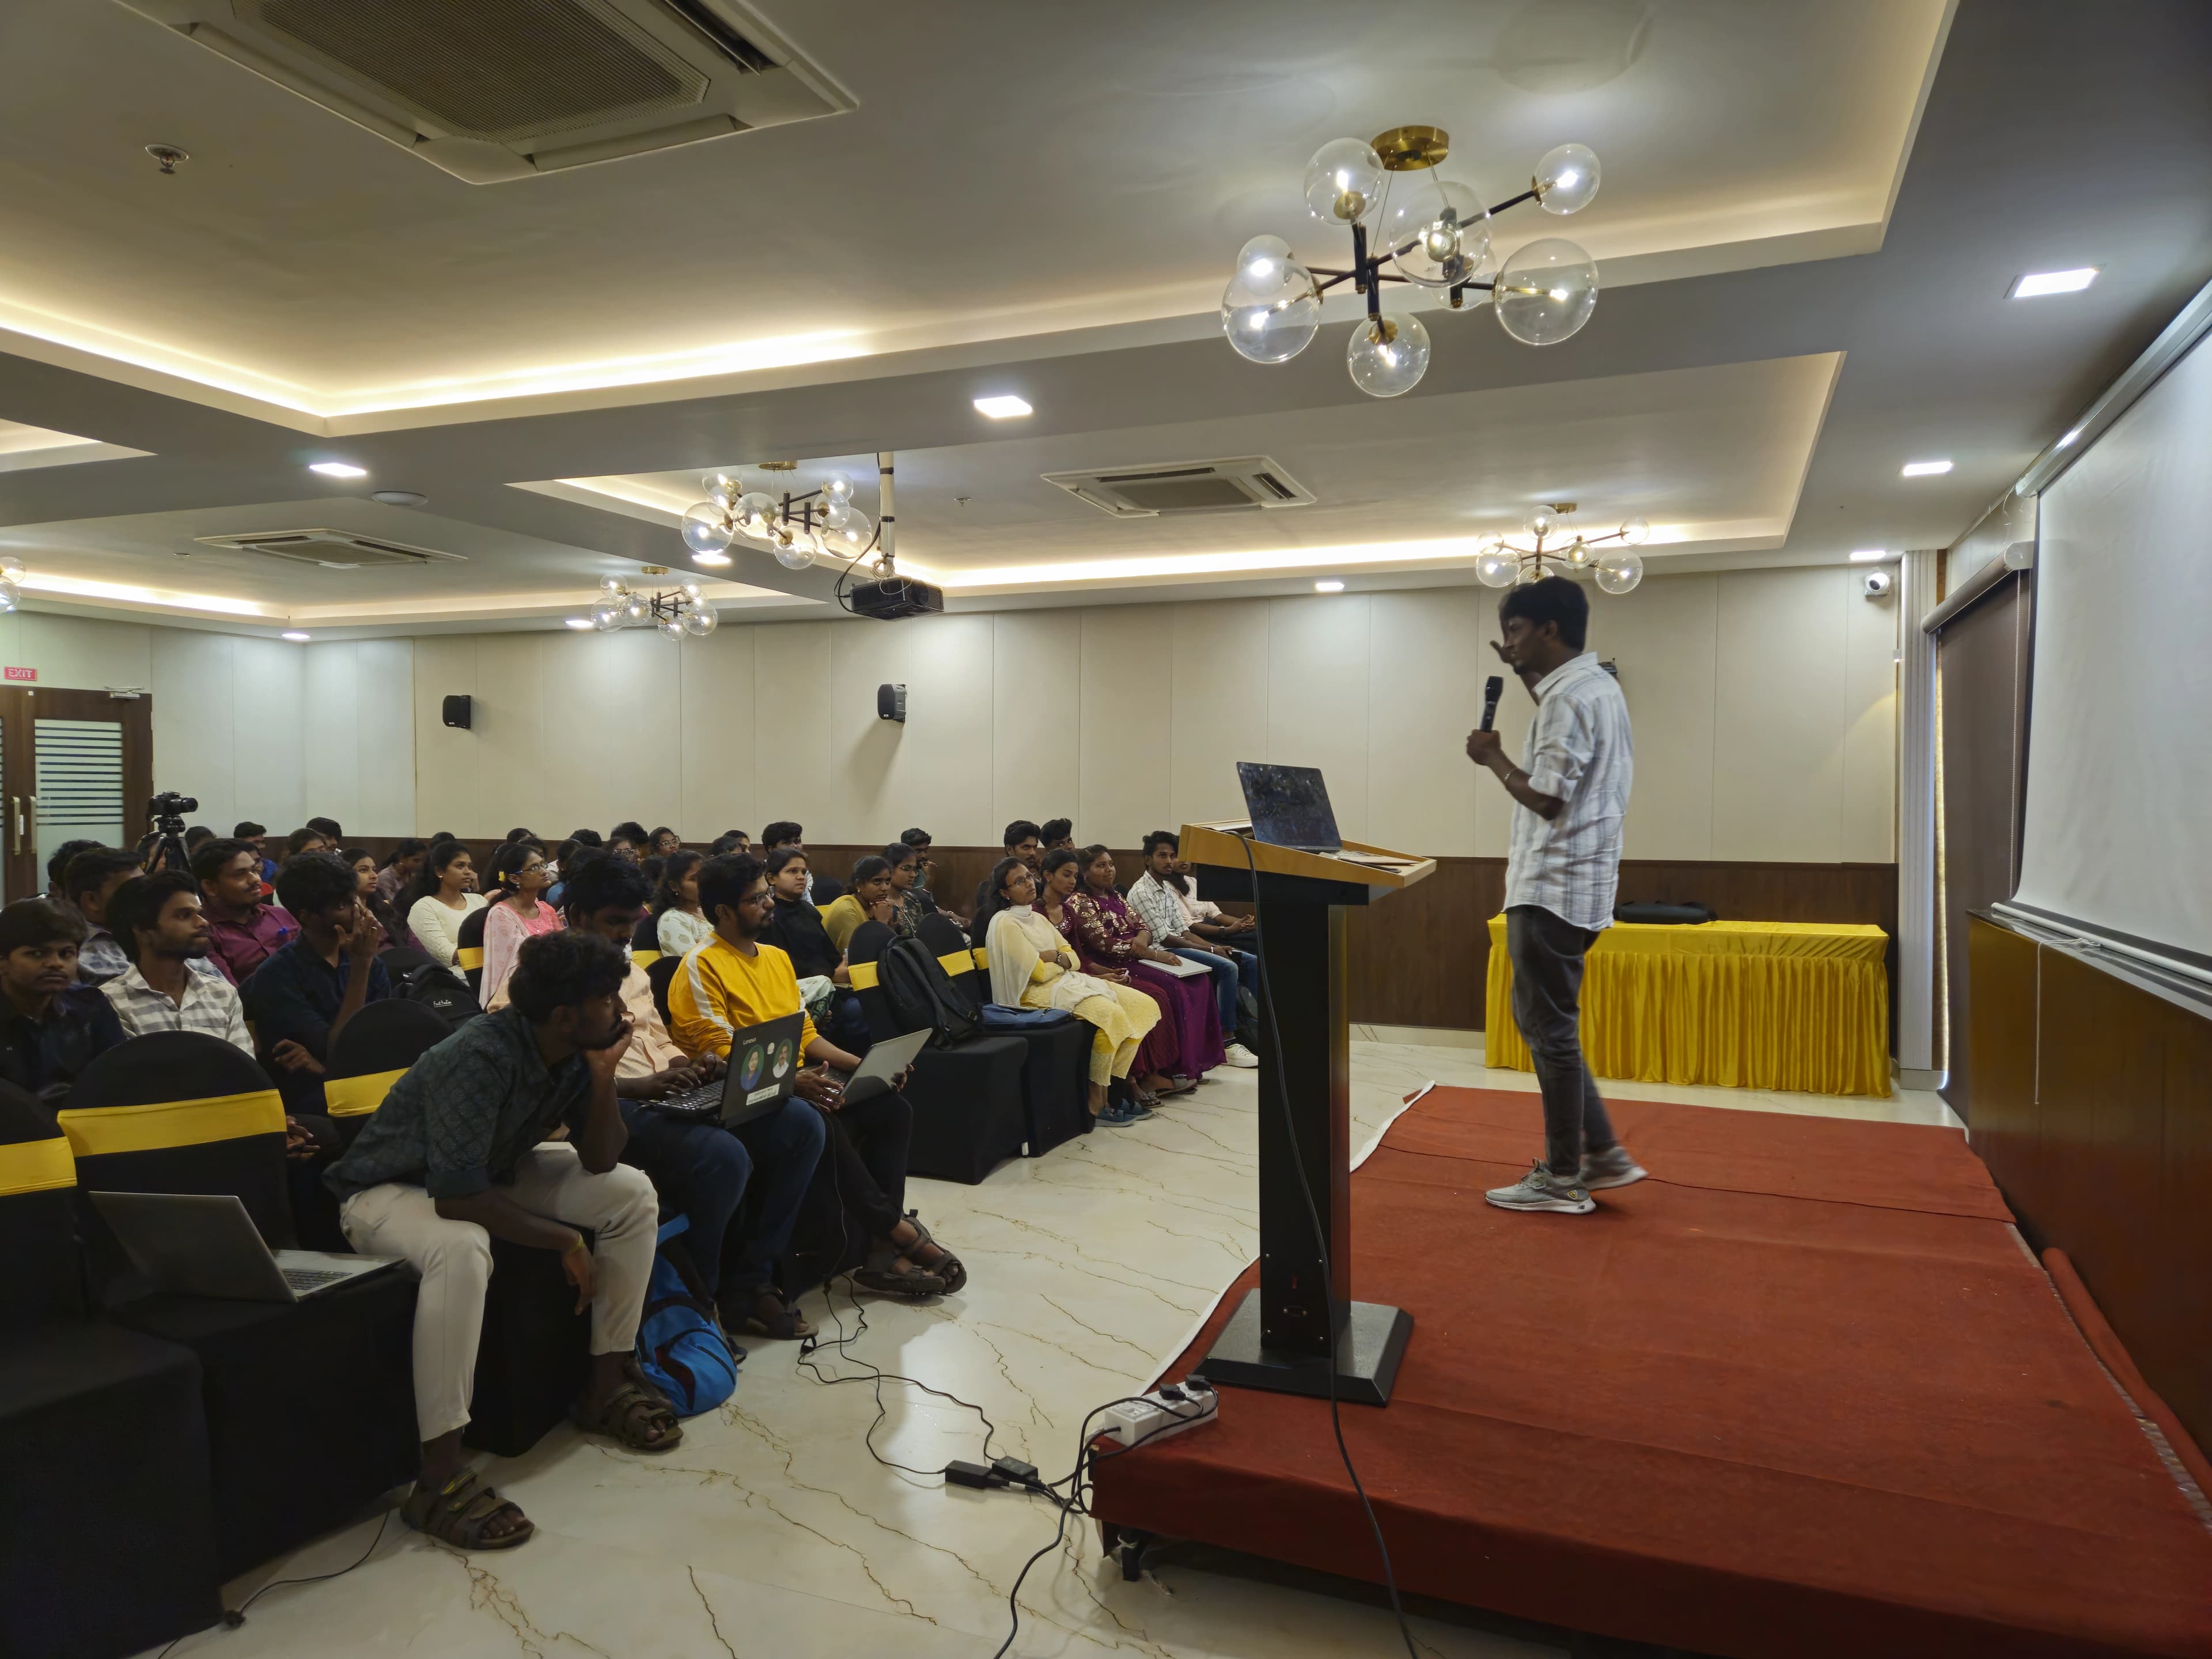
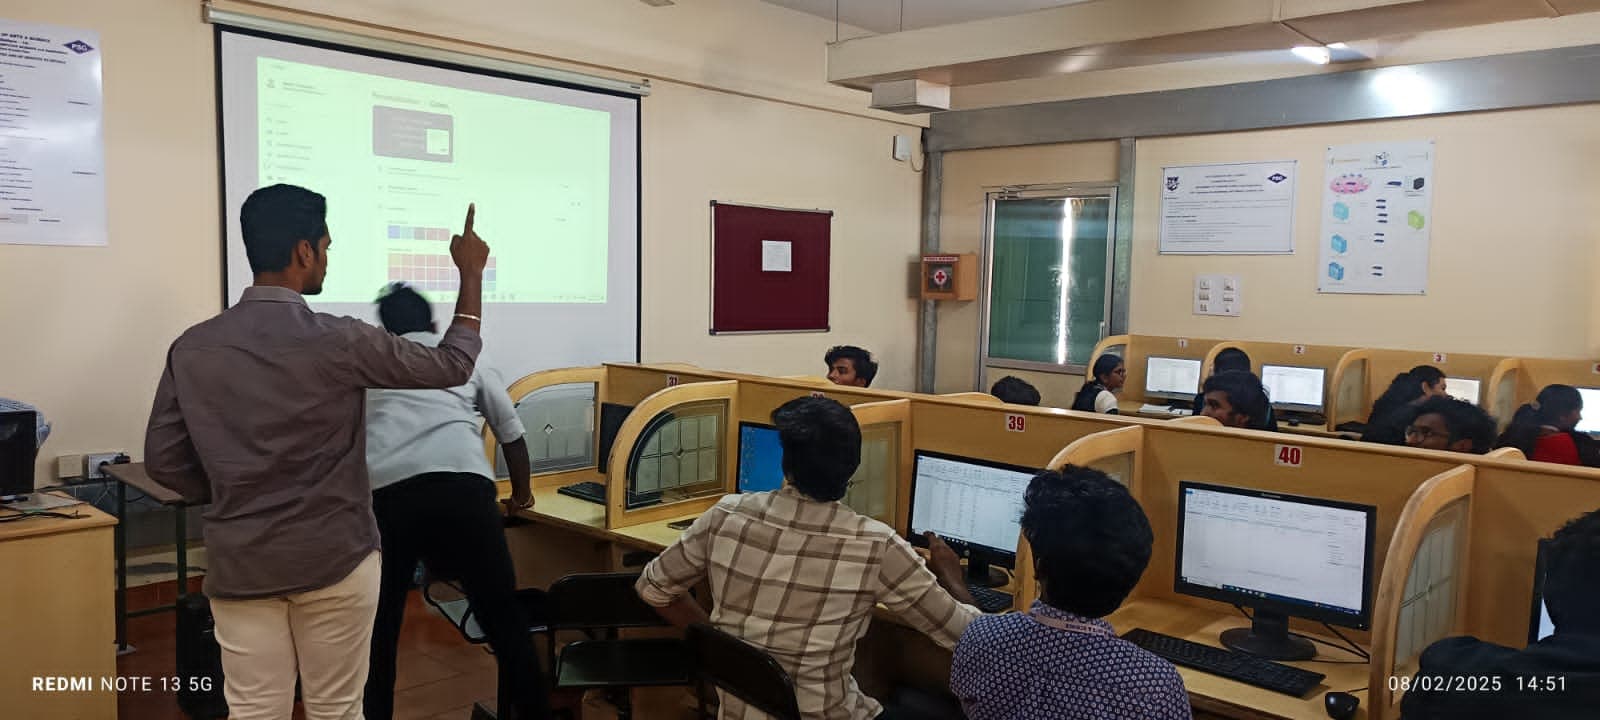
CodePurple Academy successfully conducted an intensive, hands-on Data Analytics Workshop at PSG College, Coimbatore, on February 8, 2025.
Over 70 selected students attended this specialized training, diving deep into Microsoft Power BI, data modeling techniques, and predictive data analysis.
Participants learned to transform raw, messy spreadsheets into compelling interactive dashboards that drive real business decisions.
The Power of Data-Driven Decisions
In 2025–2026, companies cannot afford to make decisions based on intuition. Organizations across every industry need analysts capable of translating numerical data into clear strategic guidance.
Power BI Core Fundamentals
Students navigated Power BI Desktop, understanding report views, data views, relationships, and model schemas.
- Connecting multiple disparate data sources.
- Building star and snowflake relational schemas.
- Implementing interactive cross-filtering.
Working with Real-World Datasets
Rather than toy samples, students analyzed real-world retail and e-commerce transactional data containing missing values and anomalies.
Data Cleaning & DAX Modeling
Hands-on drills with Data Analysis Expressions (DAX), calculating Year-over-Year growth, rolling averages, and custom KPIs.
"Data without context is just noise. Power BI turns that noise into clear strategic direction."
Executive Dashboard Design
Visual hierarchy, color palette selection, typography, and UX best practices for corporate executive reports.
Integrating Python with Analytics
Demonstrating how Python scripts (Pandas, Matplotlib, Seaborn) can be run directly inside Power BI for advanced statistical plots.
Enterprise Use Cases in Action
Exploring churn prediction, inventory forecasting, and financial performance reporting used by top consulting firms.
Career Scope for Analytics Graduates
Reviewing roles such as Business Intelligence Analyst, Data Analyst, Power BI Developer, and Analytics Consultant.
Student Takeaways & Feedback
Students completed their own published dashboard reports to showcase in upcoming campus placement interviews.
Conclusion & Future Cohorts
CodePurple Academy looks forward to hosting advanced machine learning and analytics hackathons with PSG College.